Every report, from the same booking data
Nothing here is a separate spreadsheet or a manual export. Every number below is drawn from your live RentalPoint data, updated automatically.
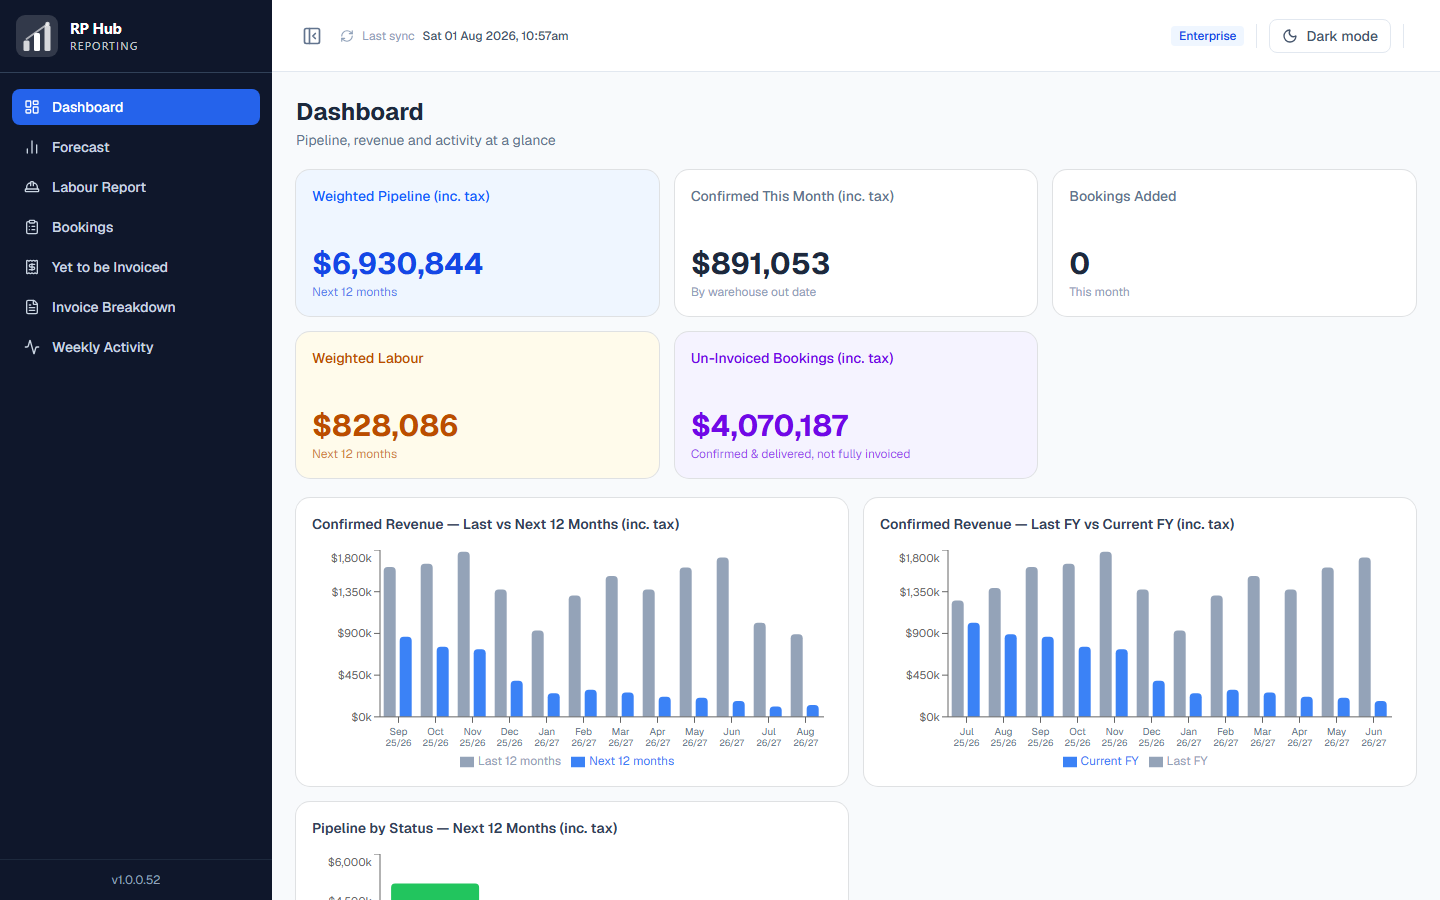
Dashboard
The one screen to open each morning. Weighted pipeline, confirmed revenue, what was invoiced and what is still to be invoiced — with the month taking shape underneath.
- ✓Headline numbers for the month and the year ahead
- ✓Pipeline by month and by status, so you can see where the work sits
- ✓Financial-year comparison against the same point last year
- ✓Recent booking activity at a glance
Forecast
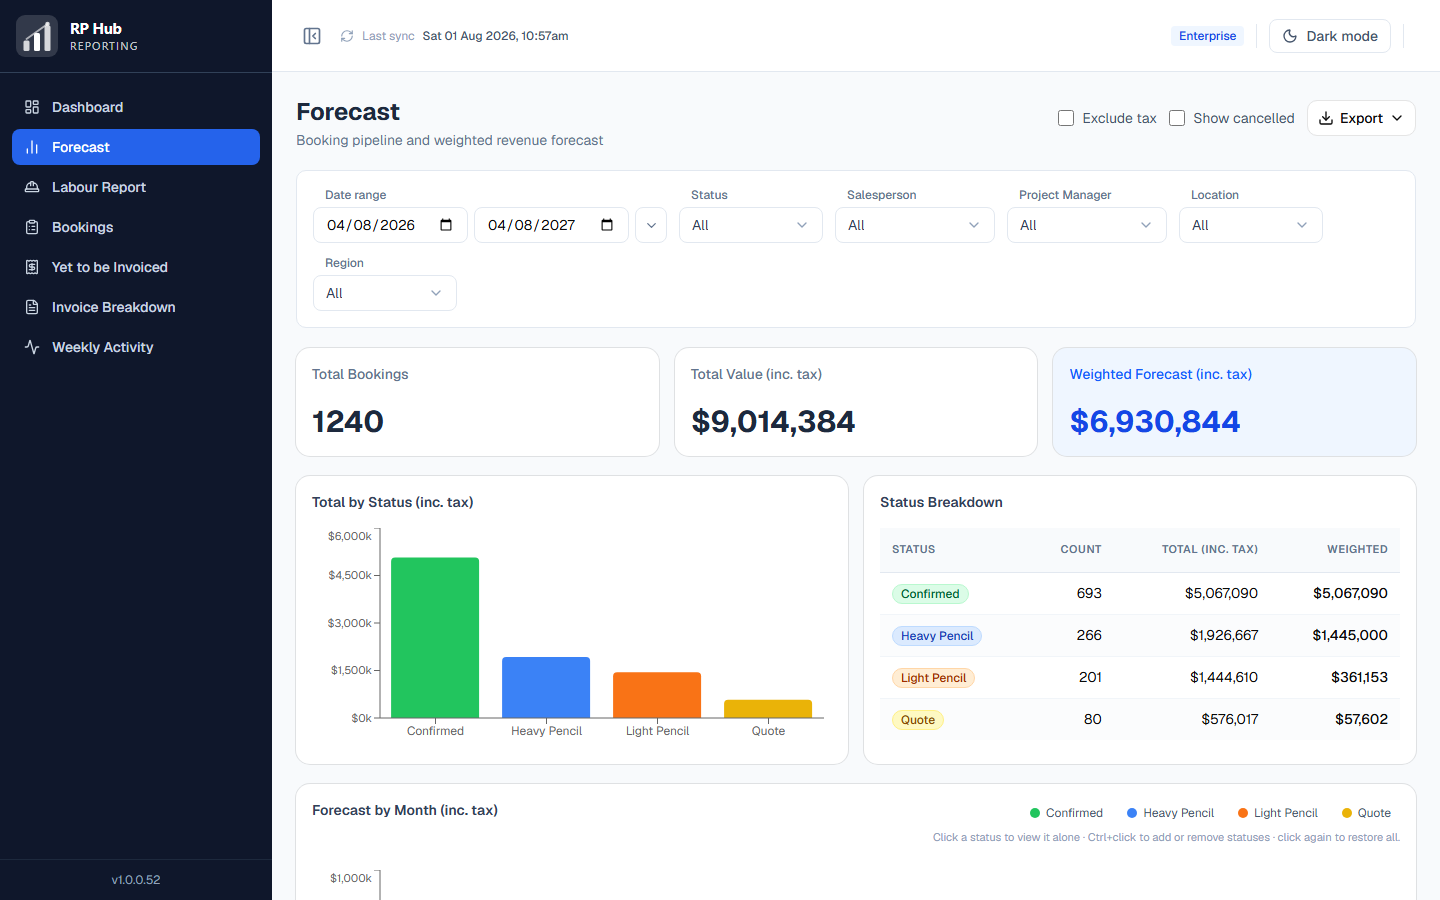
What your book of business is worth, month by month, weighted by how likely each booking is to go ahead. The report people ask for when they want to know whether next quarter is covered.
- ✓Weighted and unweighted pipeline across the months ahead
- ✓Stacked month-by-status chart — see quotes firming into confirmed work
- ✓Filter by salesperson, project manager, status, location and division
- ✓Export the month-by-status matrix to Excel or PDF
Labour Report
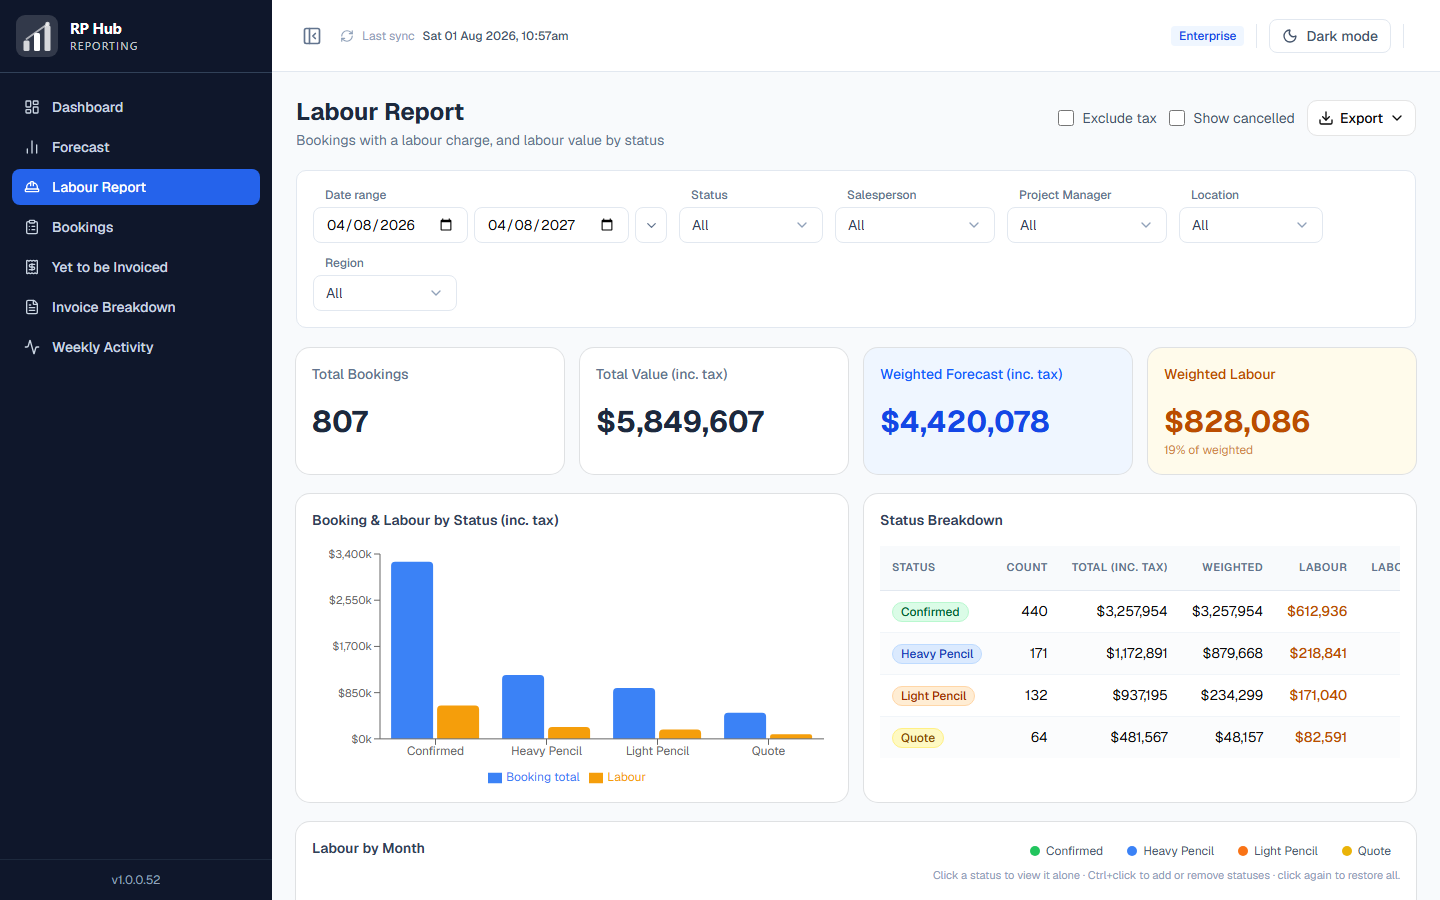
Standard and aboveHow much of your revenue is labour rather than kit. Every booking carrying a labour charge, what that labour is worth, and what share of the booking value it represents — so you can see where the crewing side of the business actually sits.
- ✓Weighted labour value alongside the weighted booking forecast
- ✓Labour as a percentage of total booking value, at a glance
- ✓Booking total against labour value, broken down by status
- ✓Labour by month, so you can see it building through the year
- ✓The same filters as every other report — salesperson, PM, location, division
Bookings
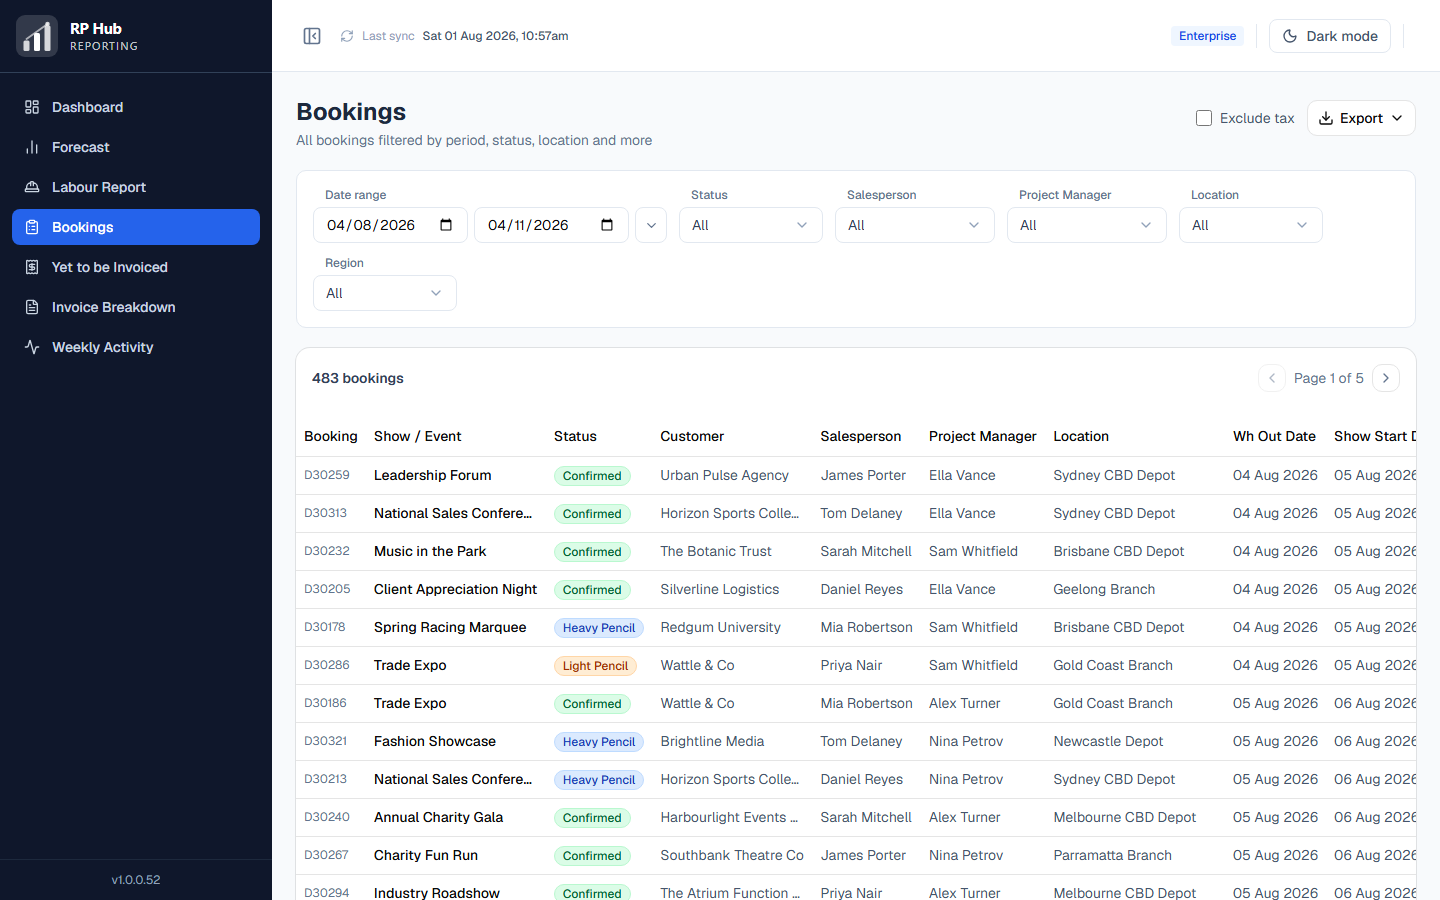
The full list behind every headline figure — searchable, filterable and exportable. When someone asks "which jobs make up that number?", this is the answer.
- ✓Every booking with its status, value, dates and people
- ✓Filter by salesperson, project manager, status, location and division
- ✓Save the filter combinations you use most and switch between them
- ✓Export any view to Excel or PDF
Weekly Activity
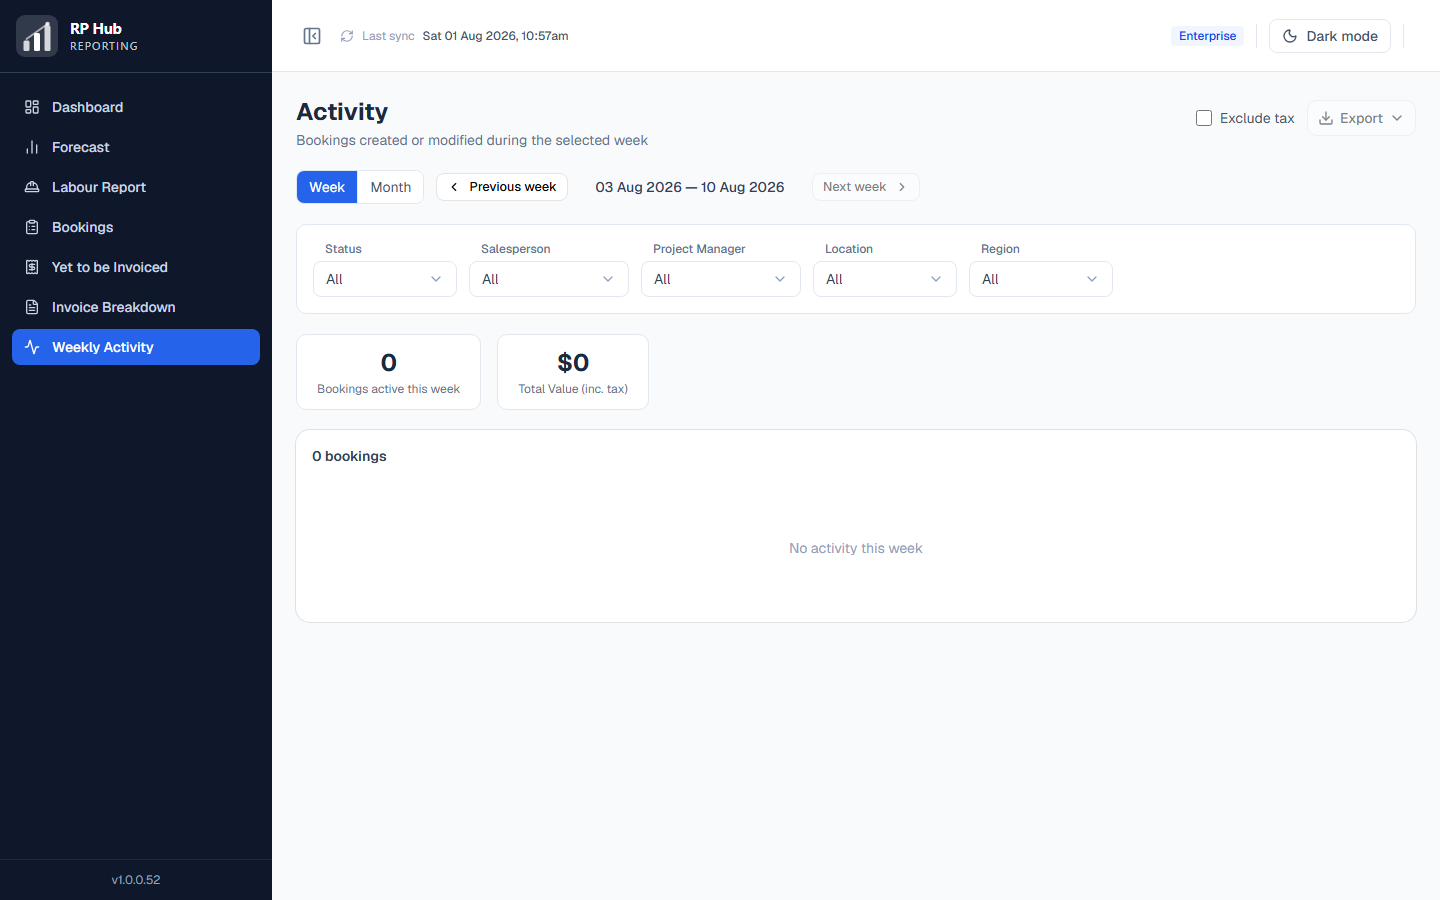
Standard and aboveWhat actually moved this week — new bookings, changes and cancellations, week by week. The report that answers "how did we go?" without anyone building a spreadsheet on a Friday afternoon.
- ✓New bookings, amendments and cancellations, grouped by week
- ✓Values alongside counts, so a quiet week of big jobs still reads correctly
- ✓The same filters as every other report
Yet to be Invoiced
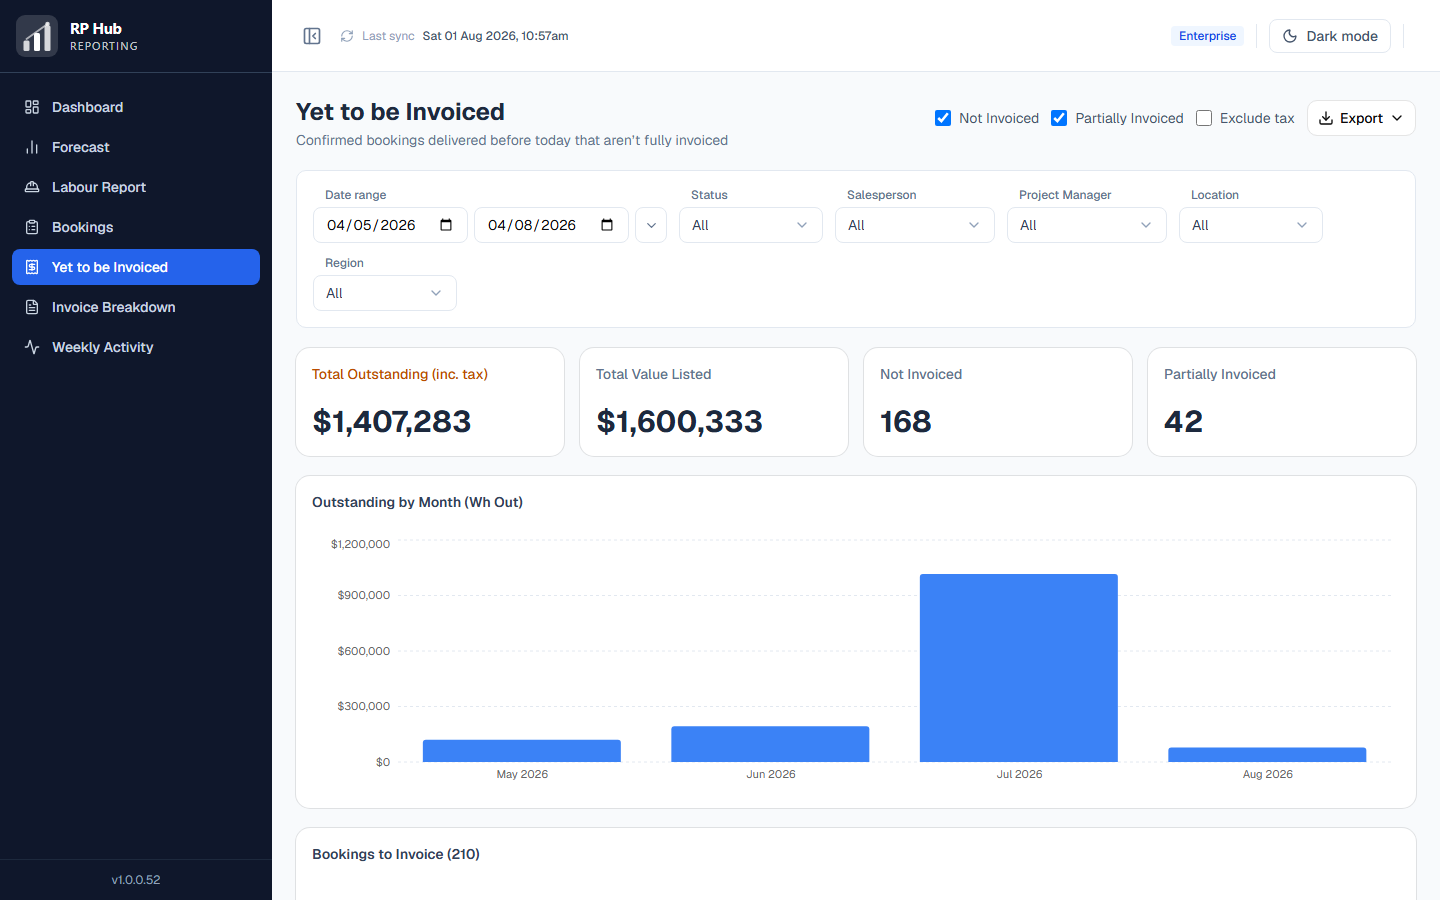
Confirmed work that has been delivered but not fully invoiced. This is the number most operators cannot get out of their system easily — here it is on a page, with the jobs behind it.
- ✓Total outstanding across confirmed, delivered bookings
- ✓Split by not-invoiced and partially-invoiced
- ✓Outstanding by month, so you can see what is ageing
- ✓No-charge bookings handled properly rather than skewing the totals
Invoice Breakdown
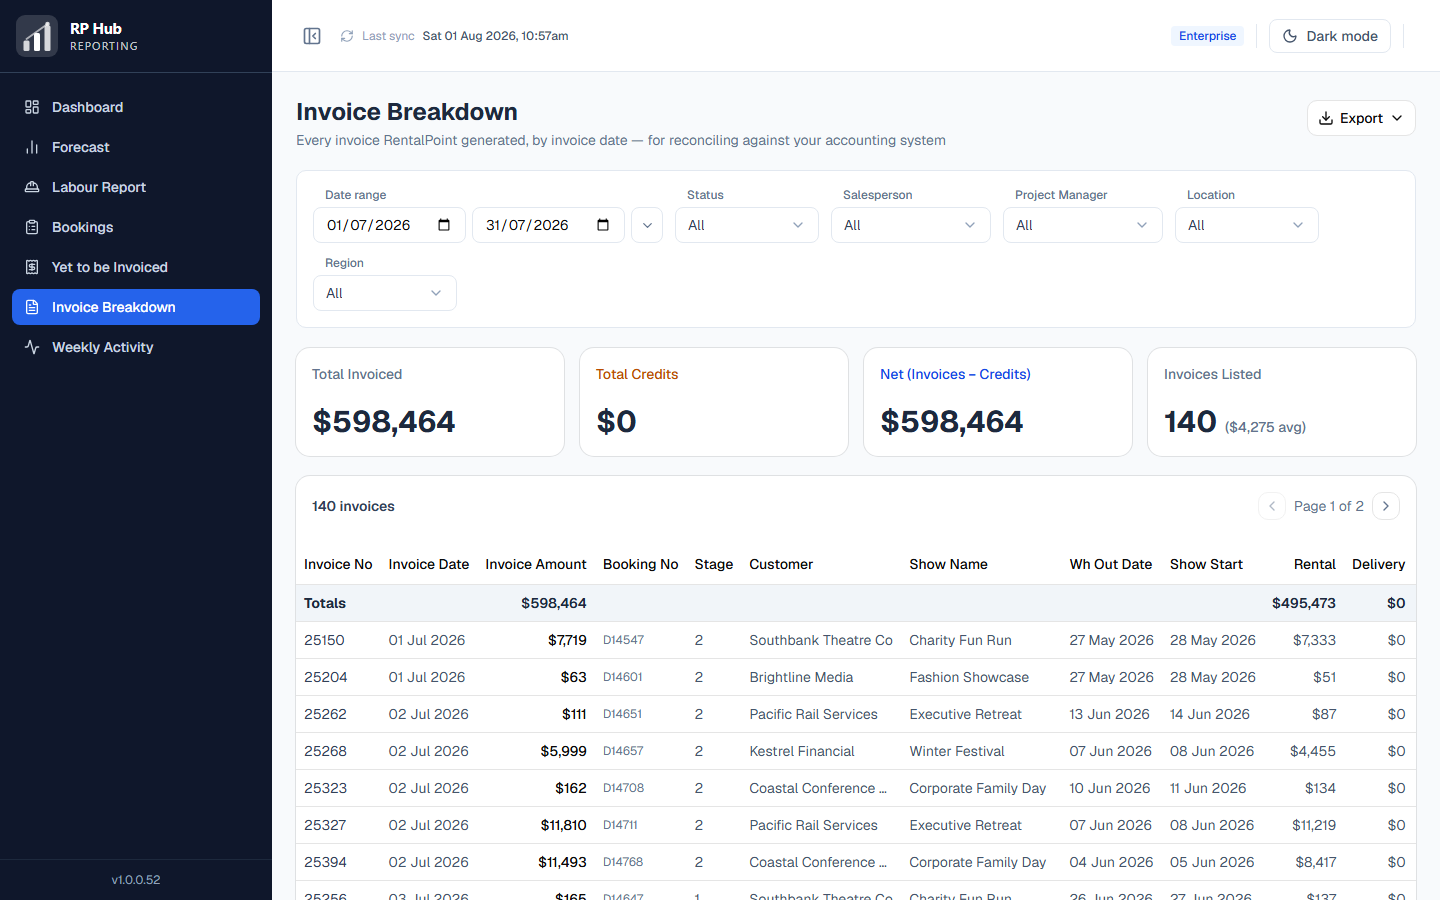
Every invoice against the booking it came from, so when a query lands you can answer it from one screen instead of three.
- ✓Invoice-level detail tied back to its booking
- ✓Invoiced value by month
- ✓Exportable, for sending on to whoever asked
And the things you would expect
Your whole team
Invite colleagues and give everyone the same numbers, on any device.
Saved views
Pro and aboveKeep the filter sets you use every week and switch between them in a click.
PDF & Excel exports
Send a board pack or drop the detail into a spreadsheet — every report exports.
Dark mode
Easy on the eyes for anyone who lives in the reports all day.
Your financial year
Set your FY start month so year-to-date means what it means in your business.
Your branding
Standard and aboveUpload your own logo to replace ours, and put your own colour through the app — carried onto every report you export.
Which reports you get depends on your plan — see what is included.
Have a look for yourself
Every report above is in the live demo, running on sample data. No sign-up, nothing to install.